pytracks.input
pytracks.grid
pytracks.track
pytracks.stats
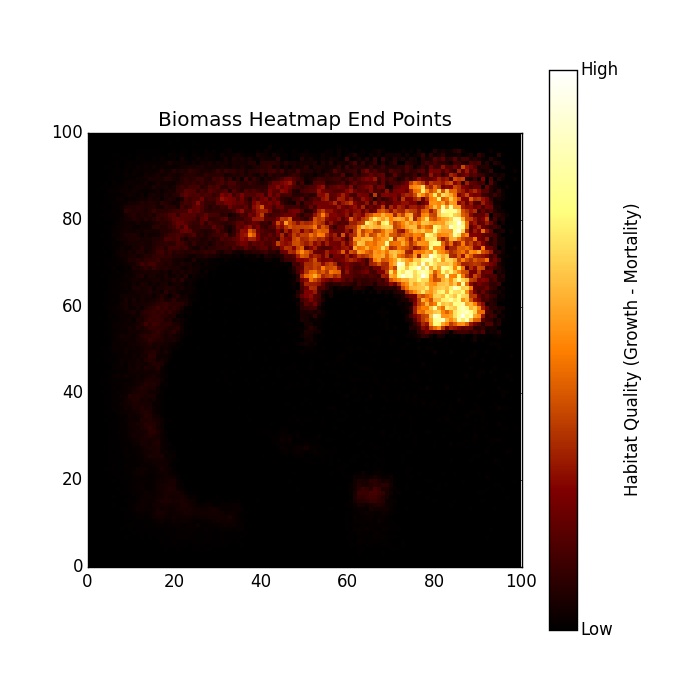
This example will visualize the cumulative amount of biomass over time. This shows where the tracks were most concentrated for every tick.